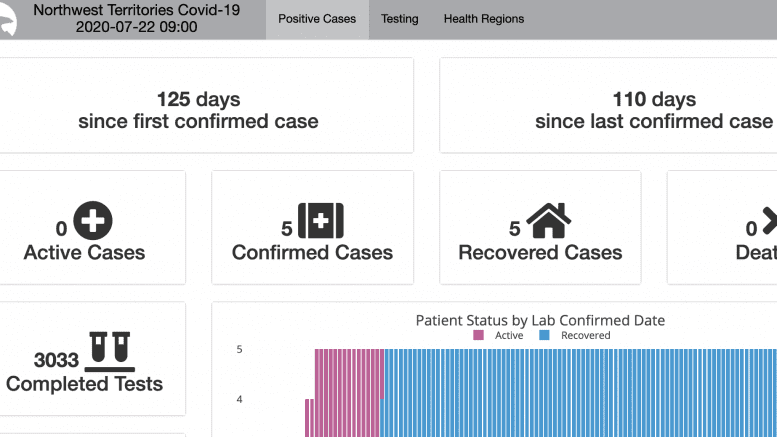
In an effort to be transparent, the territorial government has created an interactive visual dashboard to allow residents an easier look at COVID-19 data, through visual aids such as graphs and maps.
The data shows updated daily statistics on new cases, recovered cases, completed tests, a breakdown of symptoms and even the travel history of confirmed cases.
Mike Westwick, spokesperson for the GNWT says, “We have shared this information in different ways before — but now was the time to add the [visual appeal] to make our data more accessible”
The GNWT says the dashboard was put together by the epidemiology team within public health as they’ve been responsible for tracking all the testing and cases in the territory and will continue to do so.
“This dashboard helps address this challenge by presenting information through interactive charts and graphs. This is part of our commitment to being transparent in sharing of information,” says Diane Thom, minister of Health and Social Services.
The dashboard will be updated once in the afternoon every weekday, excluding statutory holidays, and with greater frequency, if the COVID-19 situation changes, whereas the government says it will move to a seven-day week update schedule.
The territory has since completed 3033 tests to date and it has been 110 days since the last positive COVID test.
Mariah Caruso is a digital journalist, originally from Toronto, Canada. She graduated from the University of Toronto with a Hons. Bachelor of Arts and completed her Journalism post-grad at Sheridan College. She has an insatiable appetite for life, storytelling, connecting to the people, and getting to the heart of the issue.
On her spare time, you can find her at your local coffee shop writing songs, poetry and prose or at the gym out-lifting men.
If you have a story idea, feel free to send her an email at mariah.caruso@cklbradio.com or call 867-766-2552 Ext 108


